SoapKit Debug Window
The SoapKit Debug Window is your mission control center for monitoring, testing, and debugging your SOAP architecture. This professional-grade tool provides real-time insights into your events, variables, and system performance.
Opening the Debug Window
Access the Debug Window through Unity's menu:
Tools > SoapKit > Debug Window
Overview
The Debug Window consists of several tabs, each providing specific debugging capabilities:
- 📊 Monitor - Real-time variable and event monitoring
- 🎯 Events - Event testing and history
- 📈 Variables - Variable inspection and manipulation
- ⚡ Performance - Performance analysis and bottleneck detection
- 🔗 Dependencies - Visual dependency mapping
- 🎮 Live Testing - Runtime testing tools
Monitor Tab
Real-Time Dashboard
The Monitor tab provides a live dashboard of your SOAP systems:
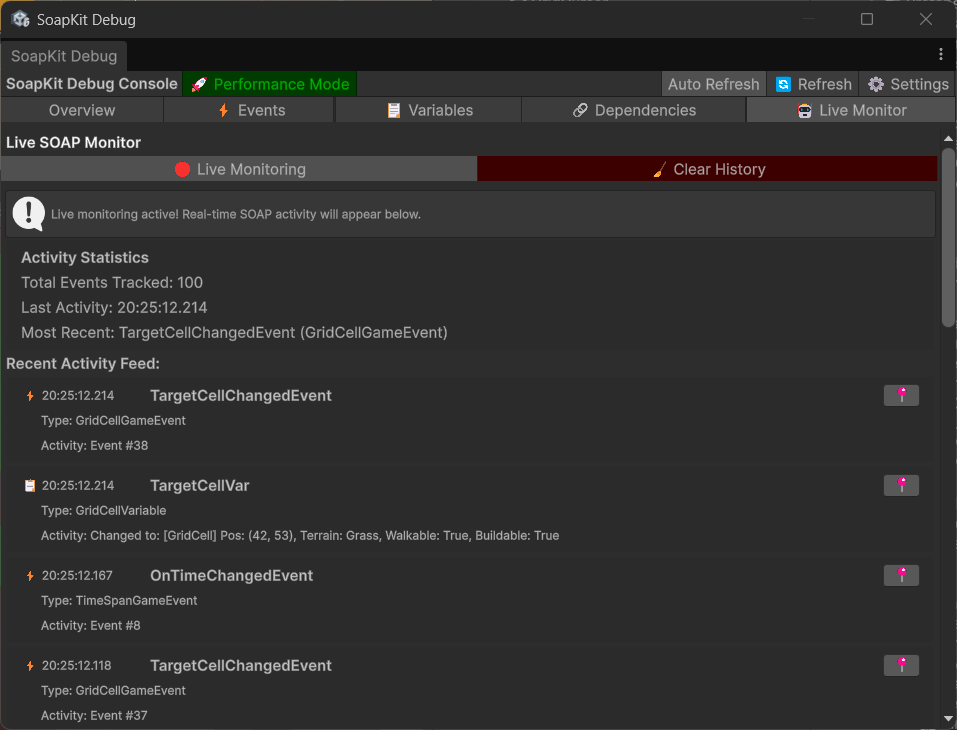
Event Information:
- Timestamp: When the event was raised
- Event Name: The ScriptableObject asset name
- Parameters: The value passed to the event
- Listener Count: How many systems are subscribed
Events Tab
Manual Event Testing
Test any event manually without requiring gameplay triggers:
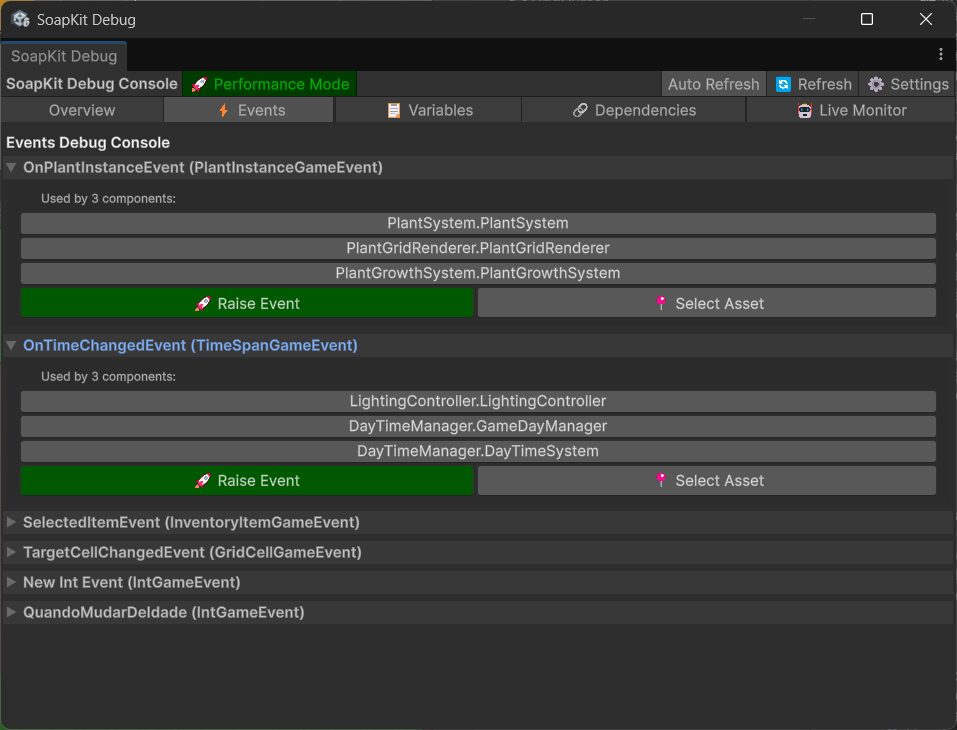
Features:
- Event List: All events in your project with current listener counts
- Parameter Input: Type-safe parameter entry for each event type
- Raise Button: Fire events manually for testing
- Batch Testing: Raise multiple events in sequence
- Event Templates: Save common test scenarios
Event Testing Examples
Testing Health System:
- Find
OnHealthChangedin the Events list - Enter test value:
50 - Click Raise Event
- Observe UI, audio, and other systems react
Testing State Changes:
- Select
OnGameStateChangedevent - Choose state from dropdown:
"Paused" - Click Raise Event
- Verify pause menu appears and game stops
Event History
View detailed history of event activity:
// Access event history programmatically
#if UNITY_EDITOR
void Start()
{
    var history = onHealthChanged.GetEventHistory();
    foreach(var entry in history)
    {
        Debug.Log($"Event at {entry.timestamp}: {entry.value}");
    }
}
#endif
History Features:
- Timeline View: Events displayed chronologically
- Filtering: Filter by event type, time range, or parameter values
- Export: Save history to CSV for analysis
- Statistics: Event frequency, peak times, and patterns
Variables Tab
Variable Inspector
Deep inspection and manipulation of variable values:

Capabilities:
- Live Editing: Change values during gameplay
- Constraint Visualization: See min/max limits graphically
- Change History: Track how values change over time
- Validation Status: See constraint violations and validation errors
- Quick Actions: Reset, randomize, or apply presets
Variable Operations
Real-Time Value Editing:
// Change values from the Debug Window during gameplay
// Values update immediately in your game systems
Constraint Testing:
- Min/Max Validation: Test edge cases by setting values at limits
- Invalid Values: See how your systems handle constraint violations
- Null Testing: Test null GameObject and Transform variables
Performance Testing:
- Rapid Changes: Stress test with rapid value changes
- Memory Monitoring: Watch for memory leaks during value changes
- Event Frequency: Monitor how often change events fire
Performance Tab
System Performance Analysis

The Performance tab helps identify bottlenecks and optimization opportunities:
Metrics Tracked:
- Event Performance: Time taken for each event dispatch
- Listener Performance: CPU time per listener callback
- Memory Usage: Variable and event memory consumption
- Allocation Tracking: Garbage collection from SOAP operations
Performance Insights
Event Hotspots:
⚡ Slowest Events (avg. time per raise)
1. OnComplexCalculation: 2.3ms (15 listeners)
2. OnUIUpdate: 1.8ms (8 listeners)
3. OnPhysicsChanged: 0.9ms (12 listeners)
Memory Hotspots:
💾 Memory Usage
├── Variables: 2.4KB (145 assets)
├── Event History: 1.8KB (500 entries)
├── Listeners: 0.6KB (67 subscriptions)
└── Total SOAP Memory: 4.8KB
Performance Recommendations
The Debug Window provides actionable optimization advice:
Example Recommendations:
- "⚠️
OnMouseMoveevent fires 60x/second - consider throttling" - "💡
PlayerHealthhas 12 listeners - consider using fewer, more focused events" - "🔧
OnUIUpdatelisteners taking >1ms - profile individual callbacks"
Dependencies Tab
Visual Dependency Mapping
Understanding how your SOAP systems connect:

Visualization Modes:
- Graph View: Node-based dependency graph
- Tree View: Hierarchical dependency tree
- Matrix View: Connection matrix for complex systems
- Flow View: Data flow between systems
Dependency Analysis
Connection Types:
- Variable Readers: Which systems read from which variables
- Variable Writers: Which systems modify variable values
- Event Raisers: Which systems raise which events
- Event Listeners: Which systems listen to which events
Example Dependency Display:
🔗 PlayerHealth (IntVariable)
├── 📖 Readers:
│   ├── HealthBar (UI)
│   ├── GameOverChecker (Logic)
│   └── HealthEffects (VFX)
├── ✏️ Writers:
│   ├── DamageSystem (Gameplay)
│   ├── HealingSystem (Gameplay)
│   └── CheatConsole (Debug)
└── 📡 Change Listeners:
    ├── OnHealthChanged → HealthUI
    ├── OnHealthChanged → AudioManager
    └── OnPlayerDied → GameManager
Circular Dependency Detection
The tool automatically detects problematic circular dependencies:
⚠️ Circular Dependency Detected!
PlayerHealth → OnHealthChanged → HealingSystem → PlayerHealth

💡 Suggestion: Break the cycle by using a separate "OnHealingComplete" event
Live Testing Tab
Runtime Testing Tools

Advanced tools for testing your SOAP architecture during gameplay:
Testing Scenarios:
- Stress Tests: Rapidly fire events to test system resilience
- Edge Cases: Test with extreme values (null, negative, max values)
- Sequence Tests: Test specific event/variable change sequences
- Load Tests: Simulate high-frequency event scenarios
Automated Test Sequences
Create and run automated test sequences:
// Example test sequence in Debug Window
Test Sequence: "Player Death Scenario"
1. Set PlayerHealth = 100
2. Raise OnDamageTaken(25) × 4
3. Verify PlayerHealth = 0
4. Verify OnPlayerDied was raised
5. Verify GameOver UI is active
Benefits:
- Regression Testing: Ensure changes don't break existing systems
- Integration Testing: Test system interactions
- Performance Testing: Measure system performance under load
- Edge Case Testing: Test boundary conditions
Advanced Features
Custom Debug Views
Create custom monitoring views for specific systems:
[CustomDebugView("Player Systems")]
public class PlayerDebugView
{
    [DebugMonitor] public IntVariable health;
    [DebugMonitor] public IntVariable mana;
    [DebugMonitor] public Vector3Variable position;

    [DebugButton("Heal to Full")]
    void HealToFull() => health.SetValue(health.Max);

    [DebugButton("Teleport to Spawn")]
    void TeleportToSpawn() => position.SetValue(Vector3.zero);
}
Export and Logging
Data Export Options:
- CSV Export: Event history and performance data
- JSON Export: Variable states and system configuration
- Unity Console: Integration with Unity's console for logging
- External Tools: Export data for analysis in external tools
Integration with Unit Tests
The Debug Window data can be used in unit tests:
[Test]
public void TestHealthSystemIntegration()
{
    // Arrange - Use Debug Window to set initial state
    DebugWindow.SetVariable("PlayerHealth", 100);

    // Act - Trigger damage through Debug Window
    DebugWindow.RaiseEvent("OnDamageTaken", 50);

    // Assert - Check results via Debug Window
    Assert.AreEqual(50, DebugWindow.GetVariable("PlayerHealth"));
    Assert.IsTrue(DebugWindow.WasEventRaised("OnHealthChanged"));
}
Keyboard Shortcuts
Navigation:
Ctrl+1- Monitor TabCtrl+2- Events TabCtrl+3- Variables TabCtrl+4- Performance TabCtrl+5- Dependencies Tab
Actions:
F5- Refresh all dataCtrl+F- Search/FilterCtrl+C- Copy selected dataCtrl+E- Export current viewSpace- Pause/Resume monitoring
Best Practices
Daily Debugging Workflow
- Morning Check: Open Debug Window, review overnight performance
- Development: Keep Monitor tab open while coding
- Testing: Use Events tab to test new features
- Performance: Check Performance tab before committing code
- Integration: Use Dependencies tab when connecting new systems
Performance Monitoring
// Set performance thresholds
DebugWindow.SetPerformanceThreshold("EventDispatch", 1.0f); // 1ms max
DebugWindow.SetPerformanceThreshold("VariableChange", 0.5f); // 0.5ms max

// Get alerts when thresholds are exceeded
DebugWindow.OnPerformanceAlert += (system, time) =>
{
    Debug.LogWarning($"{system} took {time}ms - optimization needed!");
};
Collaborative Debugging
Team Features:
- Shared Views: Export debug configurations for team members
- Remote Monitoring: Monitor builds on other machines/devices
- Report Generation: Create debug reports for team meetings
- Issue Tracking: Link debug data to issue tracking systems
Troubleshooting
Common Issues
Q: "Debug Window is empty/not showing data" A: Ensure you're in Play Mode and have SOAP assets in your scene
Q: "Performance tab shows no data"
A: Enable performance profiling in SoapKit Settings > Performance > Enable Profiling
Q: "Can't find specific variable/event" A: Use the search/filter box at the top of each tab
Q: "Debug Window is slow/laggy"
A: Reduce monitoring frequency in SoapKit Settings > Debug > Update Rate
Debug Window Settings
Access settings via: Edit > Project Settings > SoapKit > Debug Window
Configuration Options:
- Update Rate: How often the window refreshes (default: 30fps)
- History Size: Number of events/changes to remember (default: 1000)
- Performance Profiling: Enable detailed performance tracking
- Auto-Save: Automatically save debug sessions
- Theme: Light/Dark theme options
The Debug Window is your most powerful tool for SOAP development. Master it, and you'll debug and optimize your Unity games like a professional! 🔍🚀
Next Steps:
- Asset Creator - Efficiently create SOAP assets
- Dependency Visualizer - Advanced dependency analysis
- Performance Analyzer - Deep performance optimization